What is the RSI (Relative Strength Indicator) indicator?
Relative Strength Indicator (RSI) is a momentum oscillator used by numerous technical traders to discover the speed and change in price movements. RSI stands for Relative Strength Index. RSI is a leading Indicator, which has a fixed oscillating range of 0 – 100. RSI below 30 considered to be oversold and above 70 overbought. Trading with RSI standalone is not a good strategy. Some traders use RSI to find divergence to find the best possible entry. Calculation of RSI But why you should know the calculation of RSI?
As technical traders what’s going on behind it doesn’t matter, but for some people more likely who like to make bots and auto traders for automatic trading have to know these things to make something from that or modify it.
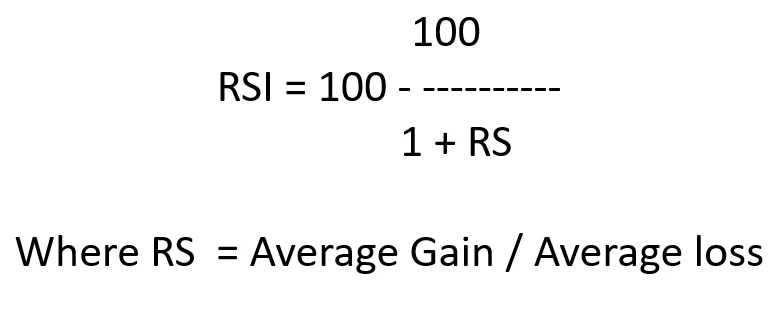
So, to calculate average gain/loss, we have to the first average gain or loss. So, assuming the default value of RSI is 14, which is obvious everywhere.
First Average Gain = the total sum of gain in the previous 14 periods / 14
Frist Average Loss = the total sum of loss in the previous 14 periods / 14
As of now, we have calculated 1st gains/ losses, then we have to calculate the Average Gain and Average Loss.
Average Gain = {(Previous Average Gain * 13) + Current Average Gain} / 14
Average Loss = {(Previous Average Loss * 13) + Current Average Loss} / 14
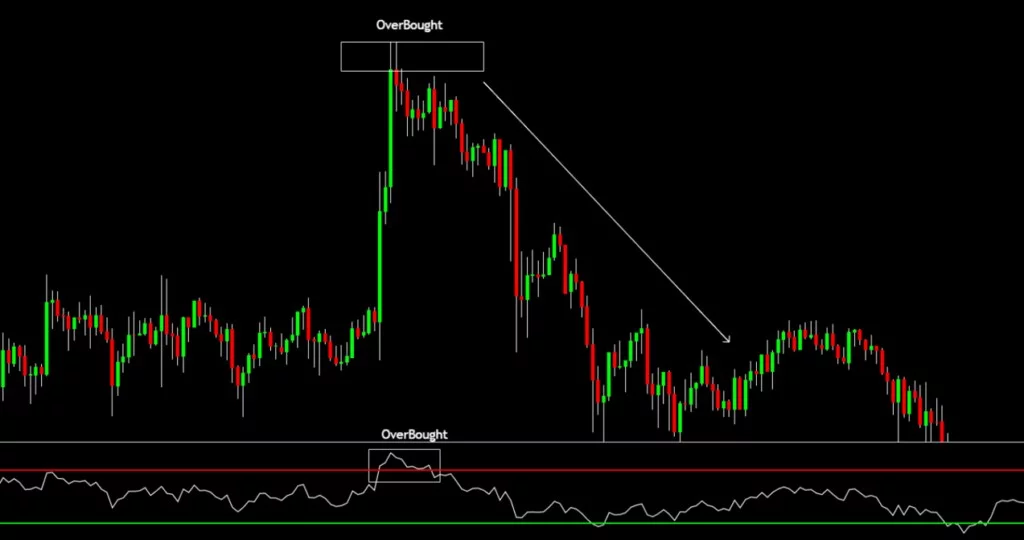
Overbought Condition:
Oversold Condition:
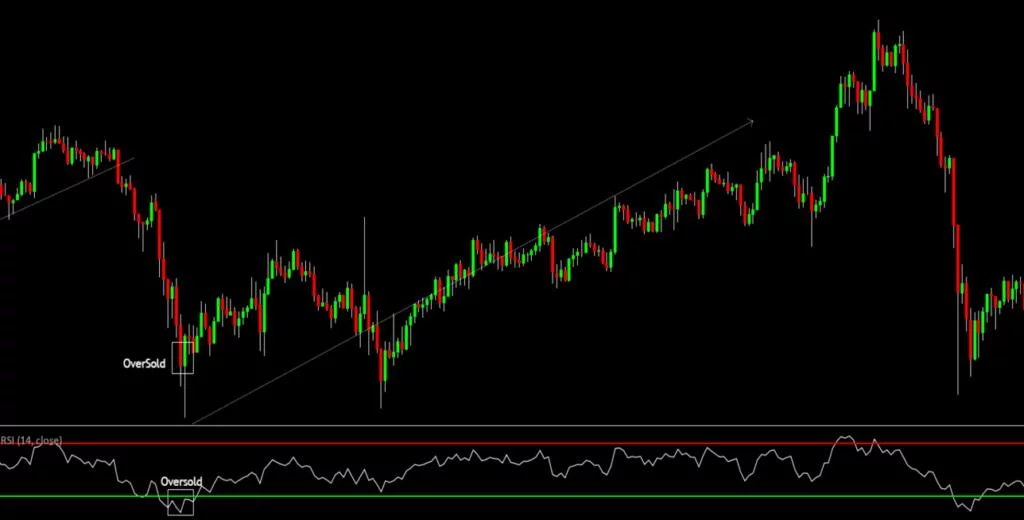
Note: Taking entry-exit using standalone RSI is not a good strategy while combining with other strategy and price action techniques will have better results.
Always Trade indicators wisely with proper risk management else your trading funds will always at high risk.
What is RSI Divergence
RSI (Relative Strength Index) Divergence is used by price action traders to enter or exit in any trade. An RSI Divergence is created when RSI (Relative Strength Index) line diverges the momentum of the market or we can say opposes the price with respect to RSI (Relative Strength Index).
When the price is making Higher High but in RSI (Relative Strength Index) making lower low or price making Lower Low or RSI (Relative Strength Index) making Higher High can be said to be a divergence. There are 2 types of divergence:
Bullish Divergence
Bullish Divergence occurs when price making continuous lower low with respect to RSI (Relative Strength Index) making a higher high, then it’s called Bullish Divergence. Remember trade divergence when you see market-making swings with high momentum otherwise sometimes false divergence occurs.
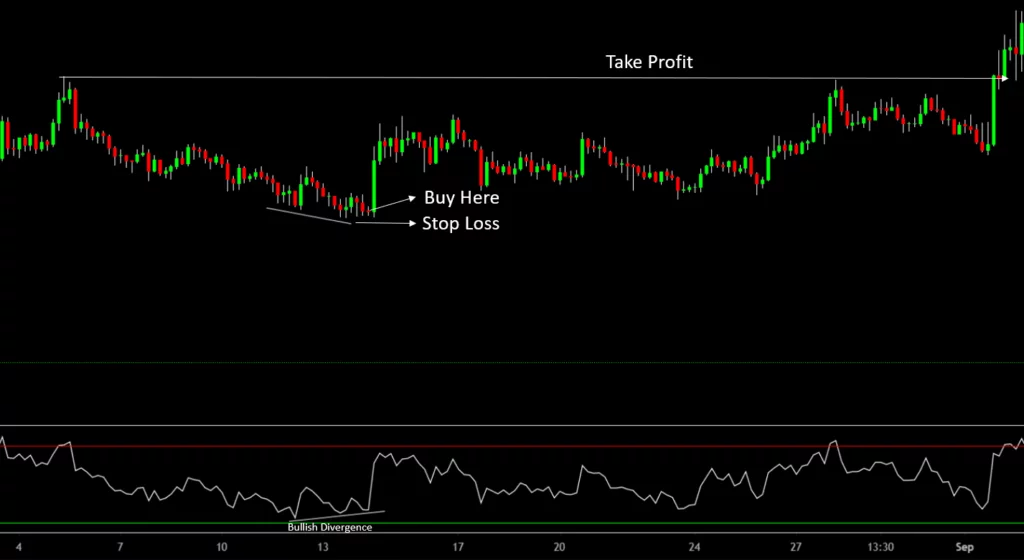
As you can see price making lower low but RSI (Relative Strength Index) going down (Making Higher high).
Bearish Divergence
Bearish Divergence occurs when the market making a higher high with respect to RSI (Relative Strength Index) making a lower low is said to be Bearish Divergence.
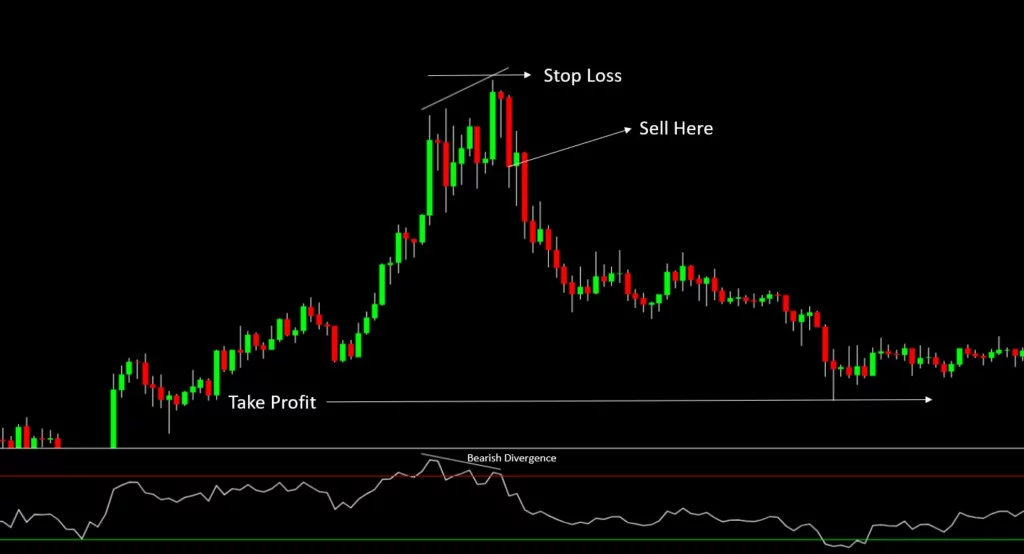
Price making higher high with respect to RSI (relative strength index) making a lower low.
What is Moving Average Convergence Divergence (MACD)?
MACD stands for Moving Average Convergence Divergence is a momentum indicator used by technical traders that calculates the interconnection between 2 EMA (Exponential Moving Averages). In MACD (Moving Average Convergence Divergence) there is fast EMA (Exponential Moving Average) of length 12, slow EMA of length 26, and a single line of length 9 by default in general.
There is also a graph looking thing called histogram which is the difference between the MACD (Moving Average Converging Divergence) line and Single Line.
Calculation
MACD Line = 12 periods EMA (Exponential Moving Average) – period 26 EMA
(Exponential Moving Average)
Single Line = 9 period EMA (Exponential Moving Average)
Histogram = the difference MACD Line and Single Line
How to use it?
Usually, traders use its crossovers for buy/sell or entries/ exits, but standalone using MACD (Moving Average Converging Divergence) is not a good idea. Use it with some kind of strategy.
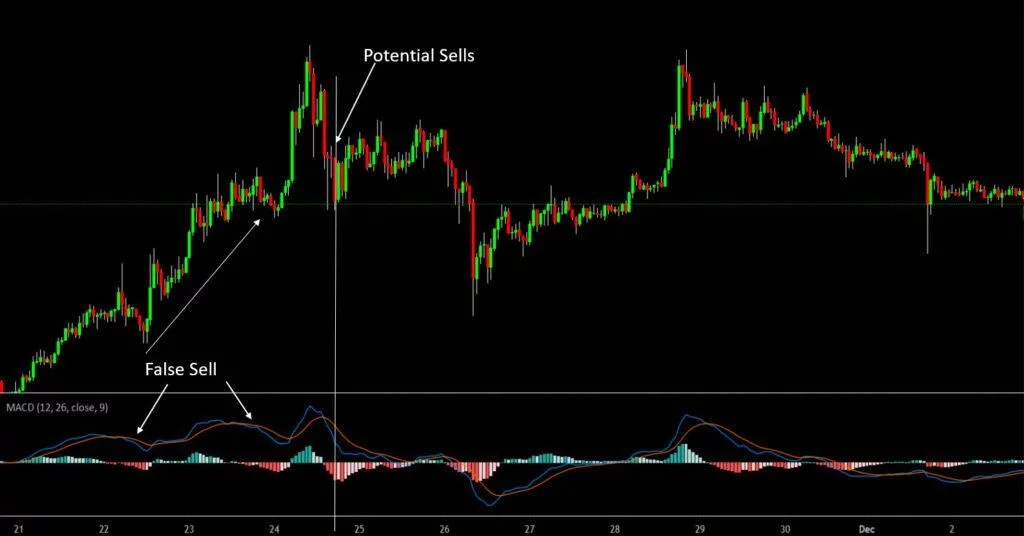
When the MACD line (Blue color) crosses over Signal Line (Red color) below the histogram then it’s a buy signal and when Signal Line (Red color) crosses below the MACD Line (Blue color) above the Histogram, then it’s a sell signal.
Note:
Crossover may happen anywhere and anytime which can be a false signal also.
Live Example
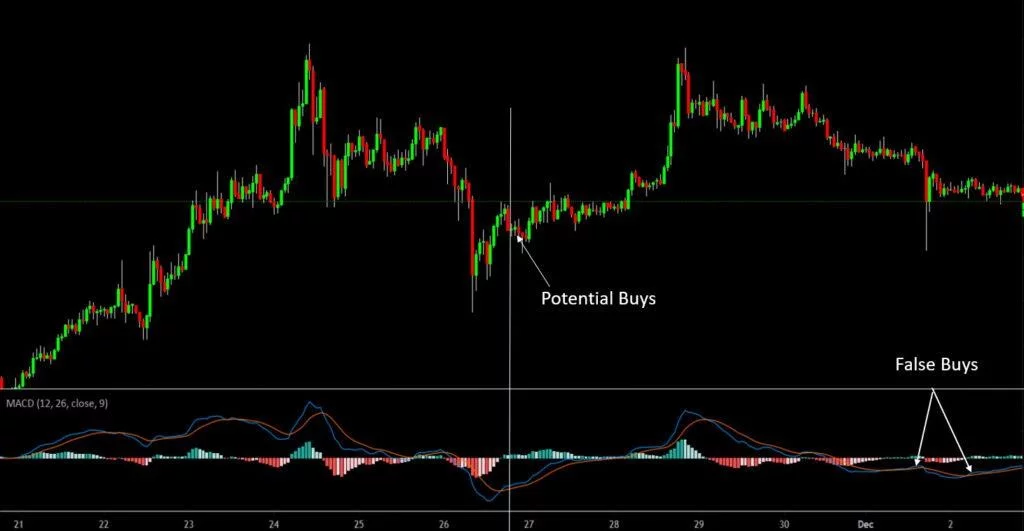
As you can see, we may get some beautiful swings with this but not always work and give false signals combine with some sort of strategy to increase accuracy.
Live Example
Note: Always Trade indicators signals wisely with proper risk management and strategy else your trading funds will always at high risk.