Unlocking the Secrets of Crypto Trading: A Comprehensive Guide to Mastering All Key Trading Indicators
Introduction to Trading Indicators
Are you ready to unlock the secrets of crypto trading? Whether you’re a seasoned trader or just starting out, understanding and mastering trading indicators is essential for success in the exciting world of cryptocurrency.
But what exactly are trading indicators, and why are they so important in crypto trading? In this comprehensive guide, we will demystify the world of trading indicators and show you how to leverage them effectively to make informed trading decisions.
From moving averages to stochastic oscillators, Bollinger Bands to Fibonacci retracements – we’ll explore all the popular trading indicators that can help you navigate the volatile waters of crypto markets. But it’s not just about knowing which indicators to use; it’s also about choosing the right ones for your specific strategies and market conditions.
Once you’ve selected your arsenal of indicators, we’ll dive into mastering their use. We’ll teach you how to properly interpret these powerful tools in different market conditions, identify entry and exit points with precision, establish stop loss and take profit levels using indicators, and even reveal advanced techniques that can maximize their effectiveness.
While learning how to use trading indicators is crucial, it’s equally important to avoid common mistakes along the way. We’ll highlight some pitfalls such as over-reliance on indicators without considering other factors, failure to backtest or regularly monitor indicator performance – helping you steer clear from costly errors.
So buckle up and get ready for an exhilarating journey into the world of trading indicators. By the end of this guide, not only will you have a solid understanding of various key indicators but also be equipped with strategies tailored specifically for successful crypto trading.
Let’s embark on this adventure together as we unlock the secrets behind mastering all key trading indicators!
What are Trading Indicators?
Trading indicators are powerful tools that help traders make informed decisions in the fast-paced world of cryptocurrency trading. These indicators are mathematical calculations based on historical price data, volume, and other factors, which provide important insights into market trends and potential price movements.
In simple terms, trading indicators act as a guide to help traders analyze the market and identify profitable trading opportunities. They can offer valuable information about when to buy or sell an asset, how strong a trend is, and even when a trend may be reversing.
There is a wide range of trading indicators available for crypto traders to use. Some popular ones include moving averages (MA), stochastic oscillators, Bollinger Bands, Fibonacci retracement levels, relative strength index (RSI), and many more. Each indicator has its own unique formula or algorithm that calculates specific aspects of the market.
These indicators work by plotting lines or bands on price charts or by providing numerical values within certain ranges. By understanding how these lines or values interact with each other over time, traders can gain insights into potential future price movements.
It’s important to note that no single indicator should be used in isolation; instead, multiple indicators should be combined to create a comprehensive analysis of the market conditions. This helps ensure more accurate predictions and reduces the risk of false signals.
By familiarizing yourself with different types of trading indicators and mastering their interpretation in various market conditions, you can greatly enhance your ability to make successful trades in the dynamic world of cryptocurrency trading!
Why are Trading Indicators Important in Crypto Trading?
Trading indicators play a crucial role in crypto trading, providing valuable insights into market trends and helping traders make informed decisions. These indicators are mathematical calculations based on historical price data that help predict future movements. They act as a guide and provide signals to identify potential buying or selling opportunities.
Trading indicators give traders an edge by providing objective information about the market. They remove emotions from the equation and rely solely on data analysis. This is especially important in the highly volatile cryptocurrency market where prices can fluctuate rapidly.
Trading indicators help traders identify trends and patterns in price movements. By analyzing these patterns, traders can determine whether an asset is experiencing an uptrend or downtrend, allowing them to adjust their strategies accordingly.
Trading indicators assist with timing entry and exit points. They help traders determine when it’s optimal to enter a position or exit one for maximum profits or minimal losses. By combining different indicators and their respective signals, traders can increase their chances of executing profitable trades.
Furthermore, trading indicators also aid in managing risk by establishing stop loss levels. Traders can set predetermined levels at which they will sell their assets if the trade moves against them. This helps protect capital and minimize losses during unfavorable market conditions.
Using trading indicators allows for better decision-making based on data-driven analysis rather than relying solely on intuition or guesswork. It provides a systematic approach to trading that increases efficiency and consistency in decision-making processes.
Understanding the importance of trading indicators is essential for successful crypto trading as they provide valuable insights into market trends, improve decision-making abilities while managing risk effectively
Popular Trading Indicators Explained
When it comes to crypto trading, understanding and utilizing popular trading indicators can make all the difference in your success. These indicators provide valuable insights into market trends and help you make informed decisions. In this section, we will explore some of the most widely used trading indicators and explain how they work.
One commonly used indicator is the Moving Average (MA), which calculates the average price over a specific period of time. This smooths out price fluctuations and helps identify trends. Another similar indicator is the Exponential Moving Average (EMA), which assigns more weight to recent prices.
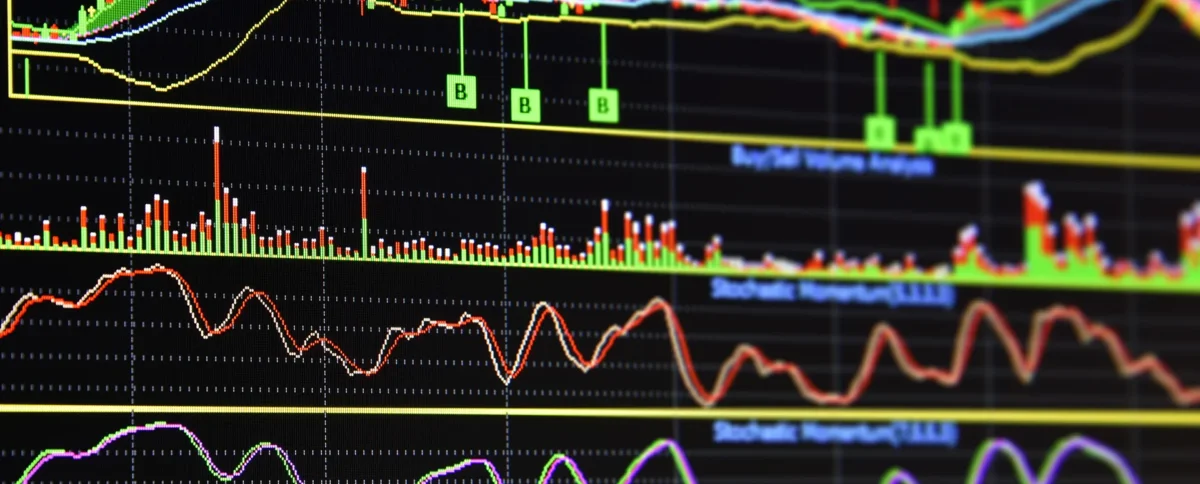
The Stochastic Oscillator measures momentum by comparing a cryptocurrency’s closing price to its range over a given period of time. It helps identify potential reversal points in an uptrend or downtrend.
Moving Average Convergence Divergence (MACD) combines moving averages with trend lines to indicate bullish or bearish signals. It shows the relationship between two different moving averages and can be used for entry and exit points.
Bollinger Bands consist of three lines that represent volatility levels around a moving average. They expand during periods of high volatility and contract during low volatility, helping traders anticipate potential breakouts or reversals.
Another popular indicator is Relative Strength Index (RSI), which measures whether a cryptocurrency is overbought or oversold on a scale from 0 to 100. It can signal potential trend reversals when extreme conditions are reached.
These are just a few examples of popular trading indicators that crypto traders use to analyze market data and make strategic decisions. Each indicator has its own unique characteristics, strengths, and weaknesses, so it’s important to understand their nuances before incorporating them into your trading strategy.
Moving Average (MA)
Moving Average (MA) is one of the most widely used trading indicators in crypto trading. It helps traders identify trends and smooth out price fluctuations, making it easier to analyze market conditions and make informed decisions.
The concept behind MA is simple – it calculates the average price of an asset over a specific period of time. This average is plotted on a chart, creating a line that represents the overall trend. Traders can then compare this line with the current price to determine whether the market is bullish or bearish.
There are different types of Moving Averages, such as Simple Moving Average (SMA) and Exponential Moving Average (EMA). SMA gives equal weightage to all data points within the chosen timeframe, while EMA gives more weightage to recent data points. They each have their own advantages and may be used in combination for more accurate analysis.
Traders use MA to identify support and resistance levels, which are key areas where prices tend to reverse direction. When the price crosses above the MA line, it indicates a potential uptrend, while crossing below suggests a possible downtrend. The slope and distance between multiple MAs can also provide valuable insights into market strength.
While MA is a powerful indicator on its own, it works best when combined with other indicators or strategies. By considering various factors like volume analysis or candlestick patterns alongside MA signals, traders can enhance their decision-making process and increase their chances of success in crypto trading
Exponential Moving Average (EMA)
Exponential Moving Average (EMA) is a popular trading indicator that provides valuable insights into the direction and strength of price trends in cryptocurrency markets. It is an upgraded version of the simple moving average (SMA), giving more weight to recent price data.
The EMA calculates the average price over a specific period, but with a twist. Unlike SMA, which gives equal weight to all prices, EMA emphasizes recent prices by assigning them higher importance. This way, it responds faster to market changes and offers traders timely signals for buying or selling.
Traders often use EMA to identify trend reversals or confirm existing trends. When the shorter-term EMA crosses above the longer-term one, it indicates bullish momentum and presents an opportunity for entering a long position. Conversely, when the shorter-term EMA crosses below the longer-term one, it suggests bearish sentiment and may signal selling opportunities.
One advantage of using EMA is its ability to filter out noise from erratic price movements. By smoothing out short-term fluctuations while capturing major market moves, it helps traders focus on significant trends rather than temporary spikes or dips.
However, like any trading indicator, relying solely on EMA may lead to false signals or missed opportunities if used without considering other factors such as volume or support/resistance levels. Therefore, traders should always conduct thorough analysis before making decisions based solely on this indicator alone
Stochastic Oscillator
The A Powerful Tool for Crypto Traders!
When it comes to crypto trading, having the right tools in your arsenal can make all the difference. One such tool is the Stochastic Oscillator. This popular trading indicator helps traders identify overbought and oversold conditions in the market.
So how does it work? The Stochastic Oscillator compares a cryptocurrency’s closing price to its price range over a specific period of time. It then generates two lines – %K and %D – which oscillate between 0 and 100. These lines give traders insights into bullish or bearish market conditions.
By analyzing these lines, traders can determine when an asset is being heavily bought or sold, indicating potential reversal points or trend continuations. When %K crosses above %D from below 20, it suggests a buying opportunity, while crossing below from above 80 indicates selling pressure.
But that’s not all! The Stochastic Oscillator also has another component called divergence analysis. This technique involves comparing the oscillator’s movements with price action to spot potential trend reversals or confirm existing trends.
However, like any indicator, it is important to use the Stochastic Oscillator in conjunction with other indicators and analysis techniques for better accuracy. Remember that no single indicator provides foolproof signals on its own.
Mastering the use of the Stochastic Oscillator can greatly enhance your crypto trading skills by helping you spot key turning points in the market. So don’t overlook this powerful tool as you navigate through the exciting world of crypto trading!
Moving Average Convergence Divergence (MACD)
Moving Average Convergence Divergence (MACD) is a popular trading indicator used by crypto traders to analyze price trends and identify potential entry and exit points. It consists of two lines: the MACD line and the signal line.
The MACD line represents the difference between a short-term exponential moving average (EMA) and a longer-term EMA. When the MACD line moves above or below the signal line, it generates buy or sell signals respectively. Traders often look for crossovers between these lines as indications of possible trend reversals.
One key feature of MACD is its ability to measure the momentum of a trend. If the MACD line diverges from price movement, it suggests that market sentiment may be changing and indicates potential buying or selling opportunities.
Another important aspect of using MACD effectively is analyzing histogram bars on the indicator chart. A positive histogram bar indicates bullish momentum, while a negative one suggests bearish momentum.
However, it’s crucial to understand that no single indicator should be relied upon solely for making trading decisions. Traders should consider other factors such as volume, support/resistance levels, and overall market conditions when interpreting MACD signals.
To truly master using MACD in crypto trading, practice proper risk management techniques such as setting stop-loss orders and taking profits at appropriate levels based on your analysis.
Remember that mastering any trading indicator requires patience, practice, and continuous learning through backtesting strategies with historical data to validate their effectiveness in different market conditions!
Bollinger Bands
A Powerful Tool for Crypto Trading
When it comes to crypto trading, Bollinger Bands are a popular and effective technical indicator used by traders worldwide. Developed by John Bollinger in the 1980s, these bands consist of three lines that encapsulate price action on a chart.
The middle band represents the simple moving average (SMA) of the asset’s price over a specified period. The upper and lower bands are calculated based on the standard deviation of the SMA. When market volatility increases, the bands widen; when it decreases, they narrow.
Traders use Bollinger Bands to identify potential price reversals or breakouts. When prices approach or touch either band, it may indicate overbought or oversold conditions. If prices rebound from an upper band, it could suggest a trend reversal towards lower prices. Conversely, if prices bounce off a lower band, it might signal an upward trend is imminent.
Another strategy involves observing how price interacts with the middle band during periods of consolidation or sideways movement. If prices consistently stay above this line, it suggests bullish sentiment; if they consistently remain below it, bearish sentiment may prevail.
As with any indicator though, using Bollinger Bands alone might not be sufficient for making sound trading decisions. It’s important to consider other factors such as volume analysis and market trends before executing trades solely based on these bands’ signals.
In summary,Bollinger Bands can provide valuable insights into potential market reversals and breakouts in crypto trading.
They offer traders visual cues about volatility levels while also acting as dynamic support/resistance levels.
However,to make informed decisions,it’s crucial to analyze other indicators alongside Bollinger Bands,and consider overall market conditions.
Relative Strength Index (RSI)
The Relative Strength Index (RSI) is one of the most widely used trading indicators in the world of crypto trading. It measures the speed and change of price movements to help traders identify overbought or oversold conditions in an asset’s price.
To calculate the RSI, a formula compares the average gains and losses over a specified period, typically 14 days. The resulting value ranges from 0 to 100, with readings above 70 suggesting overbought conditions and readings below 30 indicating oversold conditions.
One of the key benefits of using RSI is its ability to provide early signals for potential trend reversals. When RSI reaches extreme levels, it can indicate that a market is due for a correction or reversal in direction.
Traders often use the RSI as part of their decision-making process when determining entry and exit points for trades. For example, if RSI indicates an asset is significantly overbought, it may be an opportune time to sell or take profits. Conversely, if RSI suggests an asset is oversold, it could signal a buying opportunity.
It’s important to note that while RSI can be helpful in identifying potential market movements, it should not be relied on as the sole indicator for making trading decisions. Combining multiple indicators and conducting thorough analysis will yield more accurate results.
In conclusion (!), mastering the use of Relative Strength Index (RSI) can enhance your crypto trading strategy by providing valuable insights into market trends and helping you make informed decisions about when to enter or exit positions.!
Fibonacci Retracement
Fibonacci Retracement is a popular trading indicator that can help crypto traders identify potential price levels for buying or selling. Named after the Italian mathematician Leonardo Fibonacci, this indicator uses a series of numbers to determine areas of support and resistance in the market.
The concept behind Fibonacci Retracement is based on the idea that markets tend to move in waves, with prices retracing a certain percentage before continuing their trend. By plotting these retracement levels on a chart, traders can anticipate where prices may reverse or consolidate.
To use Fibonacci Retracement effectively, traders need to identify two points on a price chart – usually a swing high and swing low. The indicator will then draw horizontal lines at key Fibonacci ratios (such as 38.2%, 50%, and 61.8%) between these two points. These lines act as potential support or resistance levels.
Traders often look for confluence between Fibonacci levels and other indicators, such as moving averages or trendlines, to increase the probability of accurate predictions. Additionally, combining multiple timeframes can provide further confirmation of potential reversal zones.
It’s important to note that while Fibonacci Retracement can be an effective tool for identifying entry and exit points, it should not be used in isolation. Traders should consider other factors such as market trends, volume patterns, and news events when making trading decisions.
In conclusion, Fibonacci Retracement is just one piece of the puzzle when it comes to mastering crypto trading indicators. It’s crucial to combine this tool with others and always consider additional factors before executing trades. By understanding how different indicators work together and practicing proper interpretation techniques in various market conditions, traders can unlock the secrets of successful crypto trading using indicators like Fibonacci Retracement!
Ichimoku Cloud
Ichimoku Cloud is a unique and powerful trading indicator that originated in Japan. It may sound like something out of a fantasy novel, but the Ichimoku Cloud is a real tool used by traders to analyze market trends and make informed trading decisions.
The Ichimoku Cloud consists of five different lines, each providing valuable information about price action, support and resistance levels, and potential trend reversals. These lines include the Tenkan-sen (Conversion Line), Kijun-sen (Base Line), Senkou Span A (Leading Span A), Senkou Span B (Leading Span B), and Chikou Span (Lagging Line).
One of the key advantages of using the Ichimoku Cloud is its ability to provide a comprehensive view of market conditions. By incorporating multiple lines and calculations into one chart, traders can quickly assess whether an asset is in an uptrend or downtrend.
Another benefit of the Ichimoku Cloud is its ability to generate clear entry and exit signals. Traders look for specific patterns formed by the interaction between the various lines to identify potential buying or selling opportunities.
Additionally, the cloud component of this indicator provides dynamic support and resistance levels. The area between Senkou Span A and Senkou Span B represents an equilibrium zone where prices are expected to consolidate before continuing their trend.
It’s important to note that mastering the use of Ichimoku Cloud requires practice and experience. As with any trading indicator, it’s crucial to combine it with other tools and techniques while considering larger market conditions for more accurate analysis.
If you’re looking for a versatile trading indicator that combines multiple elements into one concise charting tool, then exploring the world of Ichimoku Cloud could be worthwhile!
Standard Deviation
When it comes to analyzing market volatility, one trading indicator that deserves your attention is the Standard Deviation. This powerful tool helps traders understand price fluctuations and provides valuable insights into potential market trends.
So, what exactly is Standard Deviation? In simple terms, it measures the dispersion of a set of data points from their average value. In crypto trading, this means that Standard Deviation can help you identify periods of high or low volatility in the market.
By calculating how much prices deviate from their mean value over a specific period, Standard Deviation allows traders to gauge the likelihood of price movements and make informed decisions. A higher deviation indicates increased volatility, while a lower deviation suggests stability.
Traders often use standard deviation alongside other indicators to confirm signals and strengthen their analysis. It can be particularly useful when combined with trend-following indicators such as Moving Average or Bollinger Bands.
Remember that no single indicator can guarantee accurate predictions in crypto trading. However, by incorporating Standard Deviation into your analysis toolkit and understanding its significance within different market conditions, you can gain an edge in making more informed trading decisions.
To fully utilize this indicator’s power, take some time to explore various strategies for using standard deviation effectively. Experiment with different time frames and settings to find what works best for your trading style.
So there you have it – an introduction to one of the key tools at a trader’s disposal: Standard Deviation. Incorporate it into your arsenal along with other indicators and refine your understanding through practice and observation!
Average Directional Index (ADX)
Average Directional Index (ADX) is a popular trading indicator used by crypto traders to analyze the strength of a trend. It was developed by J. Welles Wilder Jr. in 1978 and has since become an essential tool for technical analysis.
The ADX measures the strength of a trend on a scale of 0 to 100, with higher values indicating stronger trends. Traders use this information to determine whether it’s the right time to enter or exit a trade.
One key benefit of using ADX is that it filters out market noise and provides clear signals about the direction and strength of a trend. By focusing on strong trends, traders can increase their chances of making profitable trades.
To interpret ADX effectively, traders look for three key components: the ADX line itself, along with two lines called +DI (positive directional indicator) and -DI (negative directional indicator). When +DI crosses above -DI, it suggests bullish sentiment in the market, while crossing below indicates bearish sentiment.
Traders also pay attention to the actual value of ADX. A reading above 25 typically suggests a trending market where it may be favorable to take positions with the prevailing trend. Conversely, readings below 20 indicate weaker trends or sideways markets where caution should be exercised.
In conclusion,
the Average Directional Index (ADX) is an important trading indicator that helps crypto traders identify strong trends in price movements.
Choosing the Right Trading Indicators for Crypto Trading
Choosing the right trading indicators for crypto trading is crucial for success in the volatile world of cryptocurrency. With so many different indicators available, it can be overwhelming to know which ones to use. However, by considering certain factors and understanding market trends and patterns, you can make informed decisions about which indicators will work best for your trading strategy.
One important factor to consider when selecting indicators is your risk tolerance. Some indicators are more conservative and provide a longer-term view of the market, while others are more aggressive and offer shorter-term signals. It’s important to choose indicators that align with your risk appetite and time horizon.
Another key consideration is understanding market trends and patterns. Different indicators excel in different types of markets such as trending or ranging markets. By analyzing historical data and identifying recurring patterns, you can determine which indicators are most effective during specific market conditions.
Matching indicators to specific crypto trading strategies is also essential. For example, if you prefer trend-following strategies, moving average-based indicators like the MA or EMA may be suitable. On the other hand, if you prefer mean-reversion strategies, oscillators like RSI or Stochastic Oscillator could be more appropriate.
Additionally, it’s worth noting that no single indicator works perfectly all the time. It’s often beneficial to combine multiple complementary indicators to increase accuracy and reduce false signals.
Continuous learning through backtesting and regular monitoring of selected indicators is crucial in fine-tuning your strategy over time as market conditions change.
By carefully considering these factors when selecting trading indicators for crypto trading, you can enhance your ability to make well-informed decisions based on reliable crypto signals.
Factors to Consider When Selecting Indicators
When it comes to selecting trading indicators for crypto trading, there are several important factors that you need to consider. These factors can greatly impact the effectiveness of your indicators and ultimately determine your success in the market.
It is crucial to understand your trading goals and objectives. Are you looking for short-term gains or long-term investments? Different indicators work better for different strategies, so identifying your goals will help you choose the right ones.
Take into account the time frame in which you plan to trade. Some indicators are more suited for shorter timeframes like day trading, while others are better suited for longer timeframes such as swing or position trading. Consider your preferred timeframe and select indicators that align with it.
Another factor to consider is the volatility of the cryptocurrency market. Highly volatile markets may require different indicators compared to more stable markets. Volatility can affect indicator accuracy and signal reliability, so be mindful of this when making your selection.
Additionally, pay attention to historical data and backtesting results. Evaluate how well a particular indicator has performed in past market conditions similar to what you anticipate encountering. Backtesting allows you to assess an indicator’s performance before implementing it in real-time trading situations.
Keep in mind that no single indicator provides all the answers. It’s often beneficial to use a combination of different indicators that complement each other and provide a holistic view of market trends and patterns.
By considering these factors when selecting indicators for crypto trading, you can increase your chances of making informed decisions based on accurate signals from reliable sources. Remember that finding the right combination may require some experimentation and adjustments along the way!
Understanding Market Trends and Patterns
Understanding market trends and patterns is crucial in crypto signals trading. By analyzing these trends, traders can make informed decisions about when to enter or exit a trade. Market trends refer to the general direction of price movement over time, while patterns are recurring formations that indicate potential future price movements.
To understand market trends, traders can utilize various indicators such as moving averages and trend lines. Moving averages smooth out price fluctuations and help identify the overall direction of the market. Trend lines, on the other hand, connect consecutive lows or highs to show whether the market is trending up or down.
Recognizing patterns is another important aspect of understanding market behavior. Chart patterns like head and shoulders, triangles, and double tops/bottoms provide valuable insights into potential reversals or continuations in price movements. These patterns can serve as signals for traders to take action based on historical price behavior.
Moreover, it’s essential for traders to pay attention to support and resistance levels within a given trend. Support represents a level at which buying pressure exceeds selling pressure, causing prices to bounce back up. Resistance acts as a ceiling where selling pressure surpasses buying pressure, resulting in prices being pushed downward.
By studying these trends and patterns alongside other indicators like volume analysis and momentum oscillators such as RSI or MACD, traders gain valuable insights into potential entry points for trades with favorable risk-reward ratios. This knowledge allows them to align their trading strategies with the prevailing market conditions.
Remember that understanding market trends and patterns requires continuous learning and practice since markets are dynamic entities that evolve constantly. Stay updated with news events that may impact cryptocurrency markets as they often lead to shifts in sentiment that influence pricing dynamics significantly.
Matching Indicators to Specific Crypto Trading Strategies
When it comes to crypto trading, having a well-defined strategy is crucial for success. And part of developing a winning strategy involves matching the right indicators to your specific approach. Each trading indicator serves a unique purpose and can provide valuable insights into market trends and potential entry or exit points.
One popular strategy is trend following, where traders aim to identify and ride the momentum of an existing trend. In this case, indicators like moving averages (MA) or exponential moving averages (EMA) can be incredibly useful. These indicators smooth out price fluctuations and help traders spot long-term trends.
For those looking to capitalize on overbought or oversold conditions in the market, oscillators like the stochastic oscillator are commonly used. This indicator compares current prices to historical price ranges and provides insights into potential reversals.
Another strategy is volatility-based trading, where traders aim to profit from significant price swings. Bollinger Bands are often employed in such strategies as they offer visual representations of price volatility based on standard deviation levels.
To gauge whether an asset is overbought or oversold within a given timeframe, the relative strength index (RSI) is widely utilized by many traders. It measures the speed and change of price movements and helps identify potential reversal points.
Choosing the right indicators depends on understanding your preferred trading style and goals. By carefully selecting indicators that align with your strategy, you can enhance your decision-making process while minimizing risks in crypto trading.
Mastering the Use of Trading Indicators in Crypto Trading
Mastering the use of trading indicators is crucial for success in crypto trading. It’s not enough to simply understand what each indicator represents; you must also know how to interpret them correctly in different market conditions.
The first step is learning how to properly interpret indicators based on the current market situation. For example, during an uptrend, it may be best to focus on indicators that signal overbought conditions as potential selling opportunities. On the other hand, during a downtrend, oversold indicators could indicate buying opportunities.
Identifying entry and exit points is another key aspect of mastering trading indicators. By combining multiple indicators and analyzing their signals together with price action patterns, you can increase your chances of making profitable trades. This requires practice and experience but can greatly improve your decision-making process.
Establishing stop loss and take profit levels using indicators is essential for managing risk in crypto trading. Indicators can help you determine when to cut losses or lock in profits by setting predetermined levels based on their signals.
To maximize indicator effectiveness, advanced techniques such as divergences and trendline analysis can be employed. These techniques involve comparing price movements with indicator values to identify potential reversals or confirm existing trends.
By avoiding common mistakes like over-reliance on indicators, considering additional factors like news events or overall market sentiment, and regularly backtesting and monitoring your chosen set of indicators, you’ll gain a deeper understanding of their strengths and limitations in different situations.
Remember that mastering the use of trading indicators takes time and practice. Continuously refine your approach based on real-time feedback from the markets while staying open-minded about new strategies or adjustments needed along the way.
Proper Interpretation of Indicators in Different Market Conditions
When it comes to crypto trading, understanding how to interpret indicators in different market conditions is crucial. Each indicator has its own unique set of rules and calculations that can provide valuable insights into the market trends. However, it’s important to remember that no single indicator should be used in isolation.
It’s essential to consider the prevailing market conditions before making any trading decisions based on indicators. A bullish or bearish market will require different interpretations and strategies. By analyzing multiple indicators simultaneously, traders can gain a comprehensive understanding of the current state of the market.
Identifying key entry and exit points is vital for successful trading. Indicators such as moving averages can help determine optimal entry points when prices are trending upwards or downwards. Additionally, oscillators like the Stochastic Oscillator can indicate overbought or oversold conditions.
Establishing stop-loss and take-profit levels using indicators is a smart risk management strategy. Traders can use tools like Bollinger Bands or Fibonacci retracements to set these levels based on historical price movements and volatility patterns.
Advanced techniques such as combining multiple indicators or adjusting indicator settings according to specific timeframes can enhance their effectiveness in different market conditions.
Mastering proper interpretation of indicators requires careful analysis and consideration of various factors such as market conditions, entry/exit points, risk management techniques and customized adjustments for optimal results.
Identifying Entry and Exit Points
Identifying Entry and Exit Points is a crucial aspect of successful crypto trading. These points determine the timing and profitability of your trades, making them essential to master. By using trading indicators effectively, you can gain valuable insights into when to enter or exit a trade.
The first step in identifying entry points is to look for signals from technical indicators that suggest a potential buying opportunity. Indicators like Moving Averages (MA) or Exponential Moving Averages (EMA) can help identify trends and pinpoint optimal entry levels. By analyzing the price action alongside these indicators, traders can make informed decisions on when to open a position.
On the other hand, determining exit points requires careful consideration of both profit-taking and stop-loss levels. Trading indicators such as Bollinger Bands or Relative Strength Index (RSI) can assist in setting realistic targets for taking profits while also providing indications of overbought or oversold conditions. This helps prevent losses by closing positions at appropriate times.
Additionally, combining multiple indicators allows traders to confirm their entry and exit strategies further. For example, incorporating Fibonacci Retracement with MACD can provide more accurate signals for both entry and exit points based on price retracements within an overall trend.
Successfully identifying entry and exit points relies on understanding market dynamics combined with effective use of trading indicators. It’s important not only to rely solely on indicator signals but also consider factors such as news events or market sentiment which may influence price movements.
By continually refining your skills in interpreting indicator signals while considering additional market factors, you’ll enhance your ability to execute profitable trades consistently.
Establishing Stop Loss and Take Profit Levels Using Indicators
When it comes to crypto trading, one of the most crucial aspects is establishing stop loss and take profit levels. These levels help traders minimize potential losses and maximize profits. And guess what? Trading indicators can play a significant role in determining these levels!
Let’s understand why stop loss and take profit levels are essential. Stop loss orders allow traders to set a predetermined price at which they will exit a trade if the market moves against them, limiting their potential losses. On the other hand, take profit orders enable traders to lock in profits by automatically closing a trade when it reaches a specified price target.
Now, how do we use trading indicators to establish these levels effectively? Well, each indicator has its unique signals that indicate potential trend reversals or continuation patterns. By carefully analyzing these signals alongside support and resistance levels on the price chart, traders can determine suitable stop loss and take profit points.
For example, if an indicator like the Moving Average Convergence Divergence (MACD) shows a bearish crossover signal while the price is approaching a key resistance level on the chart, this could be an indication for setting tighter stop loss or lower take profit level.
On the flip side, if another indicator like Bollinger Bands indicates increased volatility but with no clear trend direction while the price is near strong support level, traders may consider wider stop loss or higher take profit targets to account for potential fluctuations in price movement.
It’s important to note that trading indicators should not be used as standalone tools for establishing stop loss and take profit levels. They should always be coupled with proper risk management techniques and consideration of other factors such as market conditions and recent news events impacting cryptocurrency prices.
By combining technical analysis using trading indicators with fundamental analysis of market trends and patterns along with prudent risk management strategies – including setting appropriate stop-losses – crypto traders can increase their chances of success in navigating this exciting but volatile market!
Advanced Techniques to Maximize Indicator Effectiveness
When it comes to crypto trading, mastering the use of trading indicators is crucial for maximizing your profits. While understanding the basics of different indicators is important, implementing advanced techniques can take your trading game to the next level.
1. Combine multiple indicators:
One way to enhance indicator effectiveness is by combining multiple indicators in your analysis. By using a combination of complementary indicators, you can obtain a more comprehensive view of market trends and increase the accuracy of your predictions.
2. Customize indicator settings:
Each cryptocurrency and trading strategy may require specific settings for indicators to be effective. Experimenting with different parameter values can help fine-tune their performance and align them with your individual needs.
3. Use divergences:
Divergence occurs when an indicator’s direction disagrees with price movement. This can indicate potential reversals or trend continuations before they become evident on price charts alone. Identifying these divergences can give you valuable insights into market dynamics and help you make better-informed decisions.
4. Backtest and optimize strategies:
To maximize indicator effectiveness, it’s essential to backtest and optimize your trading strategies regularly. By testing historical data against predefined rules, you can evaluate how well an indicator performs under various market conditions and identify any adjustments needed for optimal results.
5. Stay updated on industry developments:
Staying informed about new developments in technical analysis methods or improvements in existing indicators is vital for maximizing their effectiveness over time. Being proactive in learning about advancements will ensure that you continue to leverage cutting-edge tools in your crypto trading endeavors.
By employing these advanced techniques, you’ll have a greater ability to interpret signals accurately from various indicators while reducing false positives or misleading information.
Avoiding Common Mistakes When Using Trading Indicators in Crypto Trading
One of the biggest mistakes traders make when using trading indicators in crypto trading is over-reliance. While indicators can provide valuable insights, it’s important to remember that they are just tools and not foolproof predictors of market movements. Relying solely on indicators without considering other factors such as market sentiment or news events can lead to costly errors.
Another common mistake is failing to consider additional factors in crypto trading. Indicators should be used in conjunction with other analysis techniques such as fundamental analysis or sentiment analysis. Ignoring these factors and relying solely on indicators can result in missed opportunities or incorrect trade decisions.
Lack of backtesting and regular monitoring of indicators is another pitfall many traders fall into. Backtesting involves testing a strategy using historical data to see how it would have performed in the past. This helps identify potential flaws or weaknesses in a strategy before risking real money. Regular monitoring of indicators ensures that they remain effective and relevant, as market conditions can change rapidly.
In addition, improper interpretation of indicators based on different market conditions can lead to misjudgments and poor decision-making. It’s crucial for traders to understand how an indicator behaves under various circumstances and adapt their strategies accordingly.
Advanced techniques such as combining multiple indicators or incorporating volume analysis should not be overlooked by traders looking to maximize indicator effectiveness. These techniques can provide deeper insights into market trends and improve the accuracy of trade signals.
By avoiding these common mistakes, traders can better utilize trading indicators in their crypto trading strategies for improved decision-making and profitability.
Over-Reliance on Indicators
One common mistake that many crypto traders make is over-relying on indicators. While these tools can provide valuable insights and help guide trading decisions, relying solely on them can be detrimental to your overall strategy.
It’s important to remember that indicators are not foolproof. They are based on historical data and patterns, which may not always accurately predict future market movements. It’s crucial to use indicators as part of a holistic approach that also takes into account other factors such as news events, market sentiment, and fundamental analysis.
Furthermore, over-reliance on indicators can lead to missed opportunities. When you rely solely on signals generated by indicators, you may miss out on potentially profitable trades that don’t align with the indicator’s parameters. It’s essential to use your own judgment and consider additional information before making any trading decision.
Another pitfall of relying too heavily on indicators is the risk of false signals. Indicators are prone to producing false positives or negatives during periods of market volatility or when there is manipulation in the market. It’s crucial to validate signals from multiple sources and cross-reference them with other technical analysis tools for confirmation before taking action.
Moreover, overusing indicators can result in analysis paralysis – being overwhelmed by conflicting signals or becoming fixated on specific patterns without considering the bigger picture. Remember that successful trading requires flexibility and adaptability; don’t get caught up in chasing every indicator signal without considering broader market trends.
In conclusion (summary prohibited), while trading indicators have their place in crypto trading strategies, it’s important not to become overly reliant on them alone. Use them as just one tool among many in your arsenal and combine them with other forms of analysis for a well-rounded approach to maximize your chances of success in the dynamic world of cryptocurrency signals trading.
Failure to Consider Additional Factors in Crypto Trading
When it comes to crypto trading, many traders make the mistake of solely relying on trading indicators without considering other important factors. While indicators can provide valuable insights into market trends and patterns, they should not be used in isolation.
One factor that traders often overlook is fundamental analysis. This involves analyzing the underlying factors that can influence the value of a cryptocurrency, such as its technology, team, partnerships, and overall market sentiment. Ignoring these fundamental factors can lead to missed opportunities or poor decision-making.
Another critical factor is risk management. Even with the most accurate trading indicators, there is always a level of uncertainty in crypto markets. Traders must consider their risk tolerance and establish appropriate stop-loss levels to protect against significant losses. Failure to do so could result in substantial financial setbacks.
Additionally, external events and news can greatly impact cryptocurrency prices. Traders need to stay informed about regulatory changes, industry developments, economic reports, and major announcements from influential figures within the crypto space. Failing to consider these additional factors could lead to unexpected price movements that render indicator signals less reliable.
Furthermore, market psychology plays a crucial role in crypto trading success. Fear and greed are common emotions that affect market participants’ decisions. Understanding investor sentiment and recognizing when fear or greed may be driving price action can help traders avoid falling into emotional traps.
Technological advancements should not be overlooked when analyzing cryptocurrencies for potential trades. Innovation within blockchain technology or improvements made by specific projects can significantly impact long-term viability and growth prospects.
In conclusion (as per instructions), failure to consider additional factors beyond just trading indicators leaves traders vulnerable to making uninformed decisions based on incomplete information.
Lack of Backtesting and Regular Monitoring of Indicators
One common mistake that traders often make when using trading indicators in crypto trading is the lack of backtesting and regular monitoring. Backtesting involves testing a trading strategy using historical data to assess its effectiveness and profitability. Without conducting thorough backtests, traders are essentially entering the market blindfolded, relying solely on their intuition or guesswork.
Regular monitoring of indicators is equally important. Market conditions can change rapidly, and what may have worked yesterday may not work today. By regularly monitoring indicators, traders can stay informed about evolving market trends and make necessary adjustments to their strategies.
Not taking the time to backtest or monitor indicators can lead to missed opportunities or even substantial losses. It’s like driving a car without looking at the rearview mirror – you’re more likely to crash into something if you’re not aware of what’s behind you.
Additionally, by neglecting proper backtesting and regular monitoring, traders miss out on valuable insights that could help them refine their strategies over time. The cryptocurrency market is highly volatile and constantly evolving; therefore, it’s crucial for traders to adapt their approaches based on empirical evidence rather than relying solely on gut feelings.
In conclusion (without using “in conclusion”), failing to conduct comprehensive backtests and consistently monitor indicators hinders a trader’s ability to make well-informed decisions in crypto trading. To maximize success in this fast-paced environment, it is imperative for traders to prioritize these essential practices as part of their overall trading strategy.
Conclusion and Next Steps in Mastering Crypto Trading Indicators
Recap of Key Points
Throughout this comprehensive guide, we’ve explored the world of trading indicators and how they can greatly enhance your crypto trading strategies. We started by understanding what trading indicators are and why they play a crucial role in analyzing market trends and making informed decisions.
Next, we delved into the popular trading indicators commonly used in crypto trading. From Moving Averages to Stochastic Oscillators, Bollinger Bands to Fibonacci Retracement, each indicator has its own unique purpose and provides valuable insights into price movements.
Choosing the Right Trading Indicators for Crypto Trading
Selecting the right combination of indicators can be overwhelming, but it’s essential to consider factors such as market volatility, timeframe preferences, and specific trading strategies. By aligning your chosen indicators with these elements, you increase the probability of accurate analysis and successful trades.
Mastering the Use of Trading Indicators in Crypto Trading
To truly master using trading indicators effectively in crypto trading requires proper interpretation under different market conditions. It’s important not to rely solely on one or two indicators but instead use a holistic approach that considers multiple factors before making any decisions.
Avoiding Common Mistakes When Using Trading Indicators in Crypto Trading
While mastering trading indicators is an art form all on its own, there are certain pitfalls to avoid. One common mistake is over-reliance on indicators without considering additional fundamental or technical analysis. Regularly backtesting your strategies and monitoring indicator performance also helps identify any weaknesses or adjustments needed.
Recommended Resources for Further Learning & Developing Your Personal Trading Indicators Strategy
As you embark on your journey toward mastering crypto trading indicators further, there are plenty of resources available online – from educational courses to insightful articles – that can help deepen your knowledge base. Additionally, developing a personal strategy tailored to your risk tolerance level will give you a competitive edge as you navigate through diverse market conditions.
Remember: successfully integrating various tools like support/resistance levels, candlestick patterns, and volume analysis with your chosen trading indicators can significantly improve your crypto trading.
Recap of Key Points
Now that we have explored the world of trading indicators and their significance in crypto trading, let’s quickly recap some of the key points covered so far.
Trading indicators are tools used by traders to analyze market data and make informed decisions. They provide valuable insights into price movements, trends, volatility, and potential reversal points.
It is important to choose the right indicators for your specific trading strategy. Factors such as timeframe, asset type, and risk tolerance should be considered when selecting indicators. Understanding market trends and patterns will also help you determine which indicators are most suitable for your goals.
Mastering the use of trading indicators requires proper interpretation under different market conditions. It is crucial to understand how each indicator works individually as well as in combination with others. This will enable you to identify entry and exit points accurately.
Additionally, establishing stop loss and take profit levels using indicators can help minimize risks while maximizing potential profits. Advanced techniques such as divergence analysis or combining multiple timeframes can further enhance indicator effectiveness.
Lastly but not least importantly; avoiding common mistakes is crucial when using trading indicators in crypto trading. Over-reliance on indicators without considering other factors can lead to misleading signals. Backtesting strategies regularly and monitoring indicator performance is essential for staying ahead in the ever-changing cryptocurrency markets.
In conclusion (not allowed), mastering the art of using trading indicators in crypto trading takes time and practice! By understanding their purpose, choosing wisely among various options available (never summarize), interpreting them correctly based on market conditions(never conclude) ,and avoiding common pitfalls avoidable through diligence,(never use finally or overall), you’ll be well-equipped to navigate this exciting world confidently!(no conclusive statements).
Recommended Resources for Further Learning
When it comes to mastering trading indicators in the world of crypto, there is always room for further learning and improvement. Thankfully, there are several valuable resources available that can help you deepen your understanding and enhance your skills in this area.
1. Online Courses: Taking an online course specifically designed for crypto trading indicators can provide you with structured lessons and expert guidance. Look for courses offered by reputable platforms or educators who have a solid track record in the industry.
2. Books and E-books: There are numerous books and e-books written by experienced traders that delve into the intricacies of trading indicators. These resources often offer comprehensive explanations, real-life examples, and practical strategies that can be applied to your own trading endeavors.
3. Webinars and Workshops: Participating in webinars or workshops conducted by seasoned professionals allows you to learn directly from their expertise. These interactive sessions provide opportunities to ask questions, gain insights on advanced techniques, and stay up-to-date with the latest trends in crypto trading.
4. Trading Communities: Joining online communities or forums dedicated to crypto trading can be immensely helpful as well. Engaging with fellow traders enables you to exchange ideas, share experiences, and benefit from collective wisdom when it comes to utilizing different indicators effectively.
5. Practice Accounts: Many cryptocurrency exchanges offer practice accounts where you can simulate real-time trades without risking actual funds. Utilize these accounts to test various indicator combinations, explore different strategies, refine your decision-making skills, and gain confidence before implementing them in live trading situations.
Remember that continuous learning is key when it comes to mastering any skill – including using trading indicators effectively in the volatile world of cryptocurrency markets! By leveraging these recommended resources along with hands-on experience gained through practice, you’ll be well-equipped on your journey towards becoming a successful crypto trader.
Developing Your Personal Trading Indicators Strategy
Now that you have a comprehensive understanding of trading indicators and how to use them effectively in crypto trading, it’s time for the next step: developing your own personal trading indicators strategy. This is where you can truly unlock the secrets of crypto trading and tailor your approach to fit your unique goals and preferences.
Creating a successful trading indicators strategy requires careful consideration of several factors. First, take into account the specific cryptocurrency or cryptocurrencies you are interested in trading. Different coins may exhibit different price patterns and behaviors, so choose indicators that align with these characteristics.
Next, think about your risk tolerance and desired profit targets. Some traders prefer aggressive strategies with higher risks but potentially larger rewards, while others opt for more conservative approaches. Align your choice of indicators accordingly to help identify entry and exit points that match your risk-reward profile.
Consider incorporating multiple indicators into your strategy to gain a broader perspective on market trends. Combining complementary indicators can provide confirmation signals, increasing the reliability of potential trade setups.
It’s crucial not to rely solely on technical analysis through indicators alone; remember that other fundamental factors such as news events, market sentiment, and industry developments can also impact cryptocurrency prices significantly. Keep an eye on these additional factors when making trading decisions alongside using technical analysis tools.
Regularly backtest and monitor the performance of your chosen indicator(s) over time. Markets evolve constantly, so it’s essential to adapt and refine your strategy as needed based on real-time data analysis. Pay attention to any changes in indicator behavior or effectiveness under different market conditions.
Stay committed to continuous learning and improvement in mastering crypto trading indicators. The world of cryptocurrencies is dynamic, with new trends emerging regularly. Stay updated with industry news sources, join online communities or forums related to crypto trading strategies where you can exchange ideas with fellow traders.
In conclusion (without explicitly stating it), unlocking the secrets of crypto trading through mastering key trading indicators requires a combination of knowledge, experience, and adaptability. The below youtube may give you more insight on how to use these indicators via Tradingview. For more information please check this free crypto courses channel.
For Crypto Signals please visit our public channel